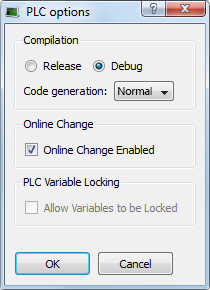
Step-By-Step Debugging

To minimize risk, the KAS IDE"Integrated development environment" An integrated development environment is a type of computer software that assists computer programmers in developing software. IDEs normally consist of a source code editor, a compiler and/or interpreter, build-automation tools, and a debugger in conjunction with the KAS Simulator allows checking and validating the application program prior to deployment of the machine/system in production. This is achieved by capturing critical events in a step-by-step mode.

In addition to the cycle-by-cycle execution mode, the debugger has a rich collection of powerful features for making step-by-step debugging in the source code of your application.

Figure 4-61: PLC Options - Debug Compiling Mode

Step-by-step debugging is available:

There are two possibilities for entering the step-by-step debugging mode:

The following commands are available from the Debug Toolbar for stepping:

Icon Description

Step Over the next instruction:
If the next instruction is a call of a function block or a sub-program, the execution passes over to the following instruction.

Step Into the next instruction:
The next step will be at the beginning of the called block
(if the next instruction is not a call of a function block or a sub-program, then the Step Into behaves like the Step Over)

Step Out the current block:
If the current stepping position is in a called function block or a sub-program, the execution continues up to the end of the current block. Otherwise, the Step out behaves like the Step Over.

In addition to these commands, you can click at any time:

Icon Description
Execute the cycle (from the current position up to the end of the last program)
Restart the target in "normal" execution mode (RUN)


Stay Connected with Kollmorgen

Copyright © 2015 Kollmorgen™